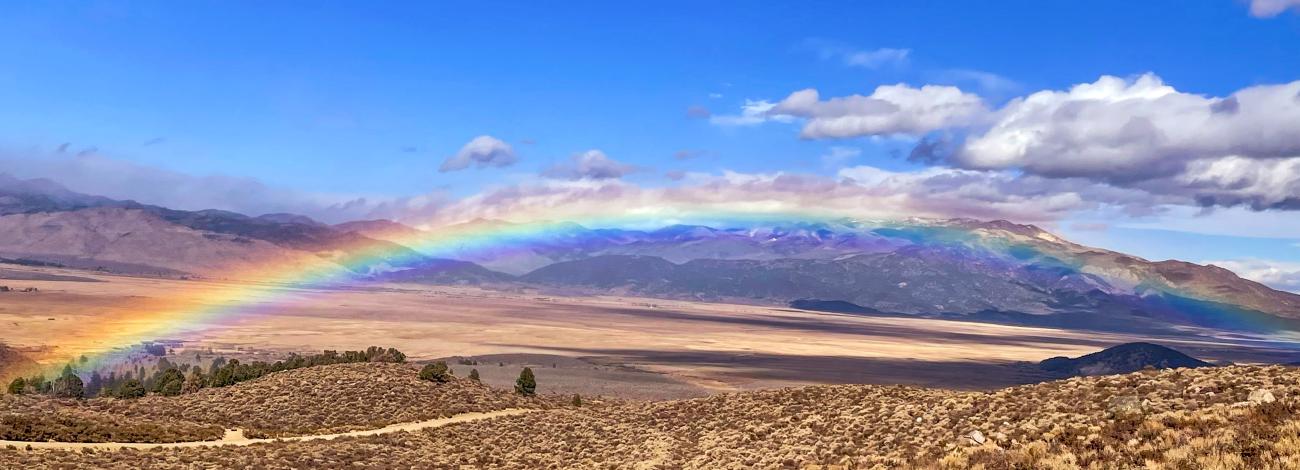
A rainbow curves above a landscape of brush and plains, with mountains in the distance.

Valuing America's Public Lands 2024

As steward for approximately 245 million acres of  America’s public lands, the Bureau of Land Management (BLM) manages some of the nation’s most historic and  scenic landscapes, as well as vast natural resources, for the benefit of all Americans. These public lands include rangelands, forests, mountains, arctic tundra, and  deserts and encompass one-tenth of the nation’s surface and approximately one-third of its subsurface mineral resources. 

This brochure provides a snapshot of how the diverse activities the BLM authorized on public lands during fiscal year (FY) 2023 generated $252.1 billion in total economic output. This economic activity supported 949,000 total jobs and contributed substantial revenue to the U.S. Treasury and state governments. This includes contributions to the economy from the BLM’s expenditures while carrying out its mission, as well as payments the agency transfers to states and counties.

Much of the data on this web page is based on the BLM's Valuing America's Public Lands 2024 publication (PDF)(link is external).

The figures and tables below report the economic contributions stemming from specific resource uses supported by BLM-managed lands and by BLM’s labor and non-labor expenditures.

    Using the interactive charts

    The charts are dynamic and interactive. Hover your mouse or tap with your finger to see the value of a bar or a pie wedge. You can toggle sectors on the pie chart by clicking them. This is helpful to enhance the view of smaller values that appear with larger values of data.  Full tables of the data in the dynamic charts are provided below.

    $252.1 Billion in Total Economic Output

    * National totals may differ from the sum of individual state numbers because they take into account activity across state borders and average industry productivity across states.
    ** Under certain laws, the BLM makes payments to states and counties that are used to help fund schools, road improvements, infrastructure, and public services within their jurisdictions. 

    Total Economic Output By State Office

    Alaska Total Economic Output
    $1,702.5M
     
    • Recreation$48.1M

    • Renewables

    • Nonenergy Minerals$1.4M

    • Oil and Gas$1,393.3M

    • Grazing

    • Coal

    • Timber$1M

    • BLM Expenditures$193.4M

    • Payments$65.2M

    Total Jobs Supported by State and Sector

    * National totals may differ from the sum of individual state numbers because they take into account activity across state borders and average industry productivity across states.
    ** Under certain laws, the BLM makes payments to states and counties that are used to help fund schools, road improvements, infrastructure, and public services within their jurisdictions. 

    Total Jobs By State Office

    Alaska Total Jobs Supported
    4,395
     
    • Recreation366 jobs

    • Renewables

    • Nonenergy Minerals7 jobs

    • Oil and Gas2,259 jobs

    • Grazing

    • Coal

    • Timber5 jobs

    • BLM Expenditures1,302 jobs

    • Payments457 jobs

    Definitions for these contributions

    • Jobs: an annual average of the number of full-time, part-time, and seasonal employees. Jobs do not equal full-time equivalents.
    • Output: the market value of production of a good or service. Output can also be expressed in terms of total sales value, or in terms of the cost to produce a good or service. 
    • Direct contributions: reflect the economic activity directly attributable to the resource use in question, such as the money spent by visitors, or mining jobs supported by the production of federal minerals.
    • Total contributions: include direct economic activity plus its ‘ripple effect’ throughout the economy. These ripples include economic activity in sectors that support activity in directly affected sectors, and economic activity generated by employees spending their labor income. 

    Each resource use supports direct and total contributions. The figures report TOTAL JOBS and TOTAL OUTPUT, while the tables below report both direct and total contributions. 

    Data Tables

    Total Economic Output
    RecreationRenewablesNonenergy MineralsOil and GasGrazingCoalTimberBLM ExpendituresPaymentsGrand Total
    Alaska$48.1M$0M$1.4M$1,393.3M$0M$0M$1M$193.4M$65.2M$1,702.5M
    Arizona$368.6M$168.6M$76.7M$0M$73.4M$0M$0M$217.1M$26.8M$931.4M
    California$1,603M$4,031.7M$634.6M$1,485.3M$52.6M$0M$4.3M$364M$112.9M$8,288.8M
    Colorado$1,458.5M$0M$152.2M$5,690.8M$76.2M$583.9M$24.2M$511.5M$269.4M$8,767M
    Eastern States$31.6M$0M$376.7M$901M$0M$42.7M$0M$343.7M$45.9M$1,741.9M
    Idaho$417.9M$0M$393.9M$0.05M$263.7M$0M$20.7M$398.7M$30.5M$1,525.8M
    Montana - Dakotas$321.2M$0M$4.8M$7,251.4M$223.6M$731.3M$17.9M$182.6M$235.4M$8,968.5M
    Nevada$401.6M$1,683.8M$6,209.3M$30.9M$222.4M$0M$0.9M$309.8M$60.5M$8,919.6M
    New Mexico$351.1M$26.6M$557.6M$70,058.7M$240.2M$0M$0.5M$309.3M$3,767.1M$75,311.3M
    Oregon - Washington$698.9M$0.2M$28.4M$0M$163.3M$0M$1,078M$503.6M$64.7M$2,537.4M
    Utah$1,965.1M$40.6M$81.7M$5,366.7M$141M$443M$3.2M$294.6M$237.3M$8,573.7M
    Wyoming$211.7M$115.8M$1,774.2M$17,349.1M$238.9M$4,099M$6.7M$164.2M$970.8M$24,930.8M
    Total Jobs
    RecreationRenewablesNonenergy MineralsOil and GasGrazingCoalTimberBLM ExpendituresPaymentsGrand Total
    Alaska366072,2590051,3024574,395
    Arizona3,15137432601,628001,3202307,028
    California10,7119,3132,3934,3814810222,13568130,117
    Colorado11,261055519,7589321,7391432,8982,15139,436
    Eastern States23201,0483,183013701,7653146,680
    Idaho4,01601,83902,74001262,76731911,808
    Montana - Dakotas2,78301618,9732,1882,199791,4352,21129,884
    Nevada3,1893,96417,9801291,861042,10546029,692
    New Mexico3,202542,031156,7235,092031,94934,625203,677
    Oregon - Washington6,102015002,40404,9523,46746917,544
    Utah16,5219638319,4542,4841,316212,0451,97844,298
    Wyoming1,8671695,13444,6422,7878,308431,2518,82573,025
    Direct Economic Output
    RecreationRenewablesNonenergy MineralsOil and GasGrazingCoalTimberBLM ExpendituresPaymentsGrand Total
    Alaska$30.4M$0M$0.8M$1,120.4M$0M$0M$0.6M$116.5M$40.9M$1,309.8M
    Arizona$195.3M$117M$42.8M$0M$22M$0M$2.2M$106.3M$14.6M$498.2M
    California$883.2M$2,491M$329.5M$843.2M$19M$0M$2.2M$189.9M$62.9M$4,821.1M
    Colorado$760.5M$0M$80.8M$2,725M$28.1M$365.6M$12.8M$255.9M$148.8M$4,377.7M
    Eastern States$14M$0M$202.3M$412.5M$0M$21.1M$0M$147M$21.2M$818.4M
    Idaho$244.4M$0M$220.4M$0.03M$109.9M$0M$11.8M$222M$18.5M$827.3M
    Montana - Dakotas$192.1M$0M$2.9M$5,042.4M$91.2M$477.6M$10.5M$102.7M$145.6M$6,065.5M
    Nevada$242.4M$1,154.4M$4,153.2M$16.7M$95.8M$0M$0.6M$177.3M$36.1M$5,876.6M
    New Mexico$219.3M$16.9M$354.4M$53,350.6M$94.2M$0M$0.3M$174.7M$2,364.9M$56,575.6M
    Oregon - Washington$382M$0.1M$15.1M$0M$60.5M$0M$580.1M$271.4M$35M$1,344.4M
    Utah$1,072.3M$22.8M$44.5M$2,987.6M$54.1M$281.1M$1.7M$154.3M$135.5M$4,745.2M
    Wyoming$143.4M$92.3M$1,254.4M$13,096.7M$111.6M$3,164.6M$4.3M$110.2M$680.1M$18,657.9M
    Direct Jobs
    RecreationRenewablesNonenergy MineralsOil and GasGrazingCoalTimberBLM ExpendituresPaymentsGrand Total
    Alaska277059090028693232,384
    Arizona2,14211714601,195006981594,457
    California7,2562,8231,1261,5932520111,28343514,777
    Colorado7,52202254,829466742721,5331,47916,869
    Eastern States143026992604407671842,333
    Idaho2,906089201,5720551,6812427,348
    Montana - Dakotas1,954078,475902966369151,66914,925
    Nevada2,3151,5518,139541,050021,35432014,787
    New Mexico2,408171,01771,4712,997021,14825,755104,815
    Oregon - Washington4,26708001,44202,0372,14429510,265
    Utah11,386271996,9381,636559111,2381,38823,382
    Wyoming1,456502,60223,6311,2484,197229167,03014,153